Intro
The goal of this project was to collect internet speeds in counties throughout California and explore the reasoning behind the differing county speeds. (Github Link)
Findings
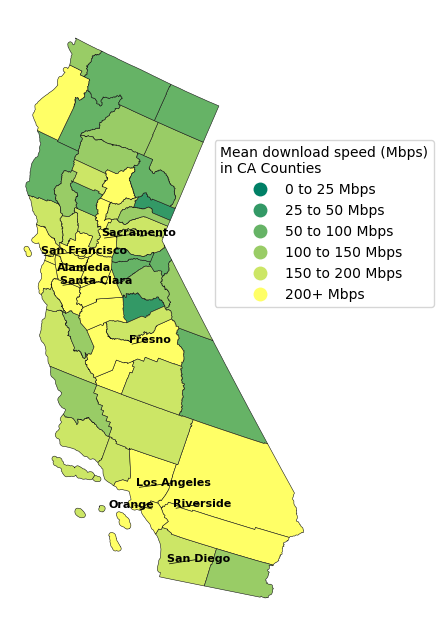
Pictured below are the top 20 counties by average download speed (Mbps).
 Contrary to what many may think, only a few counties, like San Mateo,
Contra Costa, and Alameda, ranked in the top 20 for both average internet speed
and median household income
(Census Bureau),
but more than half of the counties with top 20 internet speeds did not intersect
that top 20 income list. It is likely that there is little correlation with
county wealth and internet speeds. What I did find was that 8 out of the top 10
counties in internet speeds were located in the San Francisco-Sacramento area.
This is likely due to the high concentration of tech companies, especially in the
parts of Santa Clara, San Jose, Alameda, and San Mateo counties that are dubbed
Silicon Valley.
Contrary to what many may think, only a few counties, like San Mateo,
Contra Costa, and Alameda, ranked in the top 20 for both average internet speed
and median household income
(Census Bureau),
but more than half of the counties with top 20 internet speeds did not intersect
that top 20 income list. It is likely that there is little correlation with
county wealth and internet speeds. What I did find was that 8 out of the top 10
counties in internet speeds were located in the San Francisco-Sacramento area.
This is likely due to the high concentration of tech companies, especially in the
parts of Santa Clara, San Jose, Alameda, and San Mateo counties that are dubbed
Silicon Valley.
Process
The internet speed tests were pulled from Ookla’s API and the shapefile was pulled from the U.S. Census Burea into two GeoPandas dataframes. I then isolated rows containing data from California and then merged the dataframes. Afterwards I compiled the individual tests and grouped them by county. I then used MatPlotLib to plot the data, shading each county by their average download speed (Mbps) and labeled the 11 most populated counties for reference. (Github Link)